CHIRPS rainfall product application for analyzing rainfall concentration and seasonality
In Johor river basin, Malaysia
09 March 2024
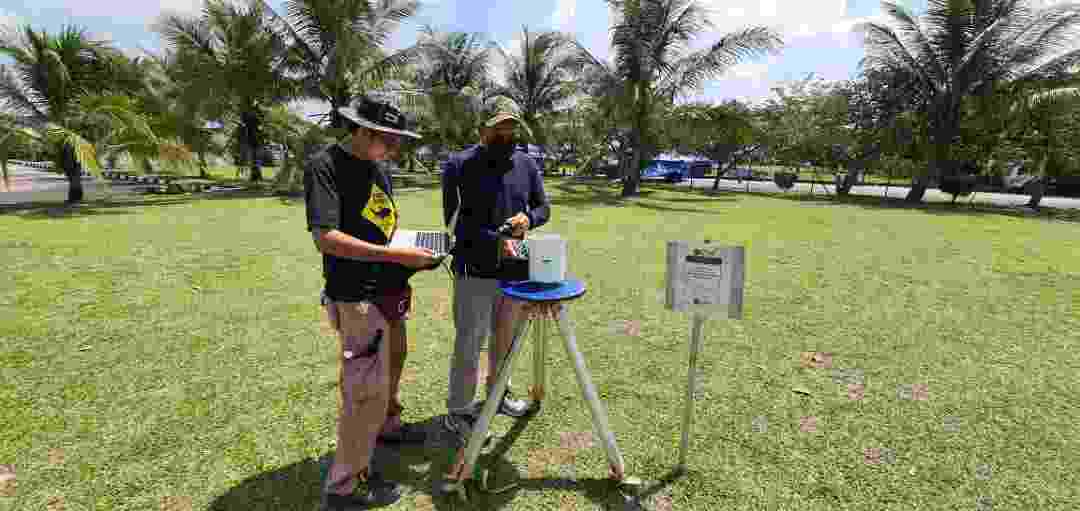
Rainfall data collection, Malaysia
Authors: Zulfaqar Sa’adi, Nor Eliza Alias, Zulkifli Yusop
Highlights:
- Spatiotemporal assessment of CHIRP-based rainfall concentration in JRB.
- SI better than PCI for basin-scale rainfall regime classification.
- CI values is highest in north-western and western area (0.61–0.72).
- Significant increase of CI is expected to cause more flood event in the future.
It is crucial to carry out a spatiotemporal evaluation of rainfall concentration in the Johor river basin (JRB) given that erratic rainfall can lead to floods. The study utilized the CHIRPS rainfall dataset from 1983 to 2018 to determine rainfall concentration using the Concentration Index (CI). To further define the rainfall regime, the Seasonality Index (SI) and Precipitation Concentration Index (PCI) were examined. The Mann-Kendall (MK) test was utilized to examine the trend at a 95% level of significance. The results showed the better accuracy of SI than PCI in classifying the rainfall regime in the JRB, defined as “equable but with a definite wetter season” type. The CI values ranged from 0.61 to 0.72 and were typically high all over the basin, with the northwestern and western regions having the highest values. At 27 grid points on the eastern border of the upper and middle parts of the basin, CI has significantly increased as a result of an upsurge in rainfall concentration brought on by climate change. More than 67% and up to 83% of the yearly rainfall for all grid locations was accounted for by the North East monsoon (NEM), with the 25% wettest days caused by high-intensity rainfall events.